
We’ve had a lot of conversations with clients about AI content. Most of those conversations involve some version of the same question: how much is too much? The internet has no shortage of opinions on this. We wanted data.
So we ran our own experiment, controlled, documented, and honest about what it showed, even when the results weren’t what we hoped to see.
The Setup
In November 2025, we registered 15 fresh domains across five niches: lifestyle and wellness, personal finance, SaaS tools, home improvement, and e-commerce product reviews. None had prior history, existing backlinks, or domain authority to speak of. We published 80 AI-generated articles to each site, 1,200 pieces of content in total.
Every article was produced using a standard AI writing workflow with light formatting applied afterwards. No subject matter expert review. No original research. No active link-building during the study period. Author attribution was minimal, generic bylines, nothing more.
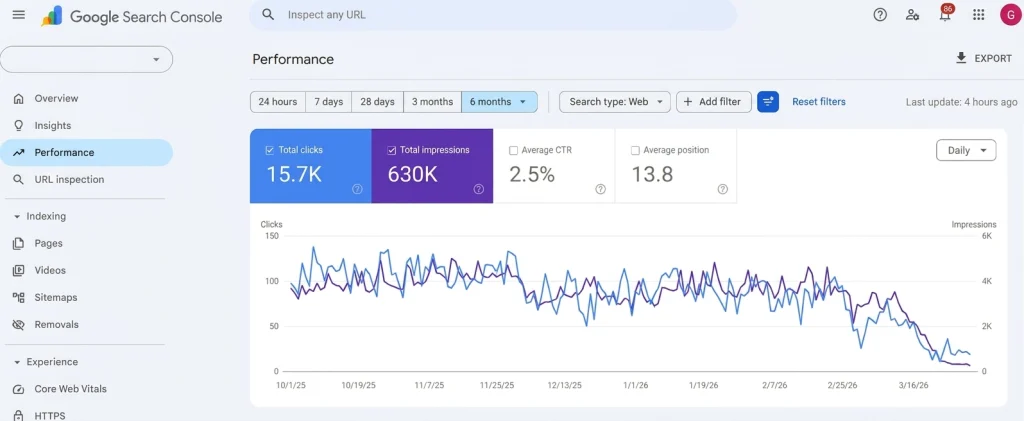
We tracked all 15 domains through Google Search Console from November 2025 through the end of March 2026, logging clicks, impressions, CTR, and average position on a weekly basis.
Month 1 – Indexing and Early Signals
The content was indexed faster than we anticipated. Within 30 days, roughly 66% of all published URLs were confirmed in Google’s index. That’s not unusual for new domains with well-structured, crawlable content. Google doesn’t discriminate at intake.
Impressions began forming across the dataset, though clicks were negligible. Most positions were landing between 60 and 90 in the SERPs. At this stage, it looked exactly like a normal new-site trajectory. Combined impressions across all 15 domains sat at around 92K. Clicks: approximately 175.
Month 2 – The Climb
This was the month that made the experiment feel successful, which, in hindsight, was the
warning sign we missed.
Impressions across the dataset grew 4.5× compared to month one, reaching around 410K combined. Clicks climbed to roughly 640. Average position moved from the high 60s to the high 40s across target keywords. Several domains started ranking on page one for long-tail informational queries. One lifestyle site briefly peaked at 940 impressions in a single day.
We noted at the time that CTR was not improving at the same rate as impressions, a meaningful signal we documented but didn’t act on.
Month 3 – Warning Signs
Growth began flattening. A few domains, particularly those targeting competitive finance and health queries, showed early signs of suppression. Crawl frequency dropped in Search Console for several properties. Rankings on previously stable URLs slipped 5 to 10 positions without any changes to the pages themselves.
Combined impressions across the dataset stayed broadly flat at around 380K, but clicks fell from 640 to approximately 510. CTR dropped from 0.16% to 0.13%. That gap between stable impressions and declining clicks matters: when users aren’t engaging with content in the SERPs, that behaviour feeds back into Google’s ranking signals. This was the inflexion point. The consequences arrived the following month.
Month 4 – The Collapse
The impact arrived over an 8-day window. Combined impressions fell from approximately 380K to under 44K, an 88% decline. Clicks dropped from 510 to under 90. Only around 5% of all published URLs retained any position in the top 100 results. The content remained in Google’s index, but it had become effectively invisible.
Six of the 15 domains received manual action notifications in Search Console, citing unnatural content patterns. One domain was fully de-indexed before the month was out.
The window between “it’s working” and “it’s over” was approximately 45 days.
Month 5 – Recovery Attempts
We filed reconsideration requests for the six sites with manual actions, pruned the lowest-quality articles on two of those domains, and added author attribution retroactively across the remaining pages.
Results were mixed. Two of the 15 domains showed partial recovery impressions returned to roughly 15–20% of their previous peak. These two sites had one thing the others didn’t: a small number of passively-acquired inbound links from unaffected external properties. The remaining 13 stayed suppressed. Recovery, where it happened at all, was slow and incomplete.
Month 6 – Stabilisation at the Floor
By the end of the six-month study, the dataset had settled into a stable but depressing equilibrium. Combined impressions across all 15 domains sat at approximately 99.9K. Clicks: 153. Average position: 58.2.
Those numbers are inflated by the two partially recovered domains. Strip those out, and the remaining 13 sites are running at near-zero organic performance, where they will likely remain without substantial editorial intervention and active authority-building.
What We Took From It
A few patterns emerged clearly when we looked at which domains held up versus which collapsed first.
Sites with zero inbound links and no brand signals were suppressed fastest and hardest. Domains publishing articles across loosely related topics within a niche, rather than building coherent topic clusters, lost rankings more quickly than those with a tighter content focus. The declining CTR pattern in month three appears to accelerate suppression rather than simply reflect it. And the two sites that partially recovered had two things in common: passive backlinks and visible author attribution.
The broader conclusion is one we expected going in, but the data made it harder to argue around: Google’s evaluation window for new domains with scaled AI content appears to be roughly 60 to 90 days. After that, a verdict comes in. For sites with no authority signals, the verdict in this experiment was unanimous.
Our Honest Take
We use AI content tools with our clients every week. We’re not going to tell you AI content is dead, because it isn’t. But there is a meaningful difference between using AI to accelerate a human-led content operation and using AI as a replacement for one.
The sites in this study had no editorial voice, no genuine perspective, and no reason to exist beyond the content itself. Google’s systems, which are getting considerably better at detecting exactly this, found that out within three months and acted accordingly.
The sites that would have survived this experiment are the ones where AI was a drafting tool inside a content system: authority established before scaling, human editorial review at the gate, genuine author credentialing, and a backlink strategy running in parallel. Not as optional extras. As foundations.
If you’re treating AI content as a cost-cutting shortcut, this data should give you serious pause. If you’re using it as a productivity layer within a properly-built SEO strategy, the picture is considerably more optimistic.
